
Escucha gratis este podcast en la aplicación: Descarga gratuita en la App Store
radio.es
Sleep timer
Favoritos
23 episodios
dbt Charts: Better Data Graphics with AI
12/11/2026 | 35 minAI agents can already build dashboards, but they leave behind a pile of one-off code that data teams can't audit or maintain. Ben Jones talks with Dave Fowler (GM of Charts at Fivetran, founder of Chartio) and RJ Andrews (author of Info We Trust, Sr. Principal Data Graphics Designer & Engineer at dbt Charts) about dbt Charts, an open-source "markdown for dashboards" that lives in a charts folder next to your dbt models.
They cover:
• Why dbt Charts does for the charting layer what dbt did for transformation
• Why charts are a social technology, and why agents need the right "grooves"
• How 350 years of chart history, including a 1930s Soviet chart with red year labels, shaped smarter defaults for ordinary bar and line charts
• Ben's first dbt Charts dashboard, built with Claude Code on live USGS earthquake data
• Language-first BI, the "Chartifact," and themes that extend each other
• Listener questions on Streamlit and Databricks, and on how fast upstream model changes reach a chart
• Why it's free for teams of up to three, in the spirit of Tableau Public
Chapters
(0:00) Welcome: Dave Fowler and RJ Andrews
(1:05) What dbt Charts is, and why AI-built dashboards need it
(2:37) Doing for charts what dbt did for transformation
(3:10) A markdown for dashboards, in your dbt repo
(4:29) Charts are a social technology
(5:40) Giving agents the right grooves
(6:57) How the project started: Chartio, dbt, and Fivetran
(8:19) "Our CEO will only read a line graph"
(10:05) A 1930s Soviet chart and making charts work harder
(11:25) Using the axis as an encoding channel
(12:27) Label every bar: opinionated defaults you can override
(13:15) RJ's design corpus
(14:58) Demo: Ben's first dbt Charts dashboard
(16:18) Language first: every dashboard is YAML
(17:35) The design panel and the "Chartifact"
(18:46) Themes that extend each other
(19:55) Outliers that bust out of the chart
(20:43) Analog vs. digital design freedom
(21:59) Designing a system, not a chart
(22:51) Listener question: where dbt Charts fits next to Streamlit and Databricks
(24:21) An open standard and an open-core business
(25:16) Free tiers: lessons from Tableau Public, Jira, and Chartio
(27:41) Charts next to models: rename a column without breaking dashboards
(28:59) Listener question: how fast do upstream changes reach a chart?
(30:38) What's next, and why charts need other people
(32:25) Getting started at dbtcharts.com
(33:44) Custom charts and the Betty White chart
(34:33) Breaking the rules, and wrap-up
Links
Episode page and full transcript: https://poweredbydata.com/podcast/dbt-charts-better-data-graphics-with-ai
dbt Charts: https://dbtcharts.com
Getting Started tutorial: https://docs.dbtcharts.com/guides/getting-started/
Dave Fowler: https://www.linkedin.com/in/dave-fowler-chartio/
RJ Andrews: https://www.linkedin.com/in/raymondjandrews/Claude on a Schedule: My First Week with Claude Duet
04/11/2026 | 14 minClaude Duet is Anthropic's platform for scheduling work you want Claude to do, currently in research preview. A week after getting off the waitlist, Ben Jones walks through his own account channel by channel:
• A daily brief that adds industry news, a quote, a brain teaser, and a "today in history" to the usual email and calendar heads-ups
• Weekly security and edge-case scans of the websites and apps he's built
• A coding tutor for daily Python lessons
• Flashcards built from his 11 courses: 243 of them, plus a list of typos it found along the way
• A refresh log that keeps four AI courses current
• Weekly newsletter research and podcast planning
• Month-end close with QuickBooks, and a draft of the quarterly Washington State excise tax CSV
His point: it isn't just reminders. The agent does the work with you, on a schedule. He also covers the limits. Duet runs on a schedule, not on triggers, and in its first week it occasionally missed or ran a task late.
Not sponsored by Anthropic. Recorded November 2026; features may change.
Chapters
(0:00) What Claude Duet is (research preview, waitlist, not sponsored)
(0:58) A tour of the interface: channels, groups, chat, and the task panel
(2:23) Customizing channels: names, instructions, icons, and colors
(3:01) The daily brief: email and calendar heads-ups
(3:35) Adding industry news, a quote, a brain teaser, and today in history
(4:41) Video ideas: the channel that helped plan this episode
(5:00) Website management: why what you build needs maintenance
(5:21) Weekly security scans of the Data Literacy site
(6:07) Scanning an inventory app for edge cases
(6:45) A coding tutor for daily Python lessons
(6:59) Flashcards for staying fresh on 11 courses
(7:37) 243 flashcards, and the typos they turned up
(8:06) A running refresh log for the AI courses
(9:23) Weekly research for the monthly newsletter
(9:56) Keeping the podcast on track
(11:19) Month-end close with QuickBooks
(11:45) Drafting the quarterly Washington State excise tax CSV
(12:13) Not just reminders: the agent does the work
(12:31) Scheduled, not triggered: how Duet checks for new email
(13:20) Rough edges: missed and late tasks in research preview
(14:09) Wrapping up, and a preview of the next episode
Links
Episode page and full transcript: https://poweredbydata.com/podcast/claude-on-a-schedule-my-first-week-with-claude-duet
Claude Duet (product page and waitlist): https://claude.com/product/claude-duet
Introducing Claude Duet: https://claude.com/resources/articles/claude-duet
Get started with Claude Duet: https://support.claude.com/en/articles/17631495-get-started-with-claude-duet
Note: this is a screen-share episode, so the video version on Spotify and YouTube shows the walkthrough.Pitfall-Proof Your Claude Dashboards | Powered by Data Ep. 6
15/10/2026 | 17 minBen Jones turned his book Avoiding Data Pitfalls into a Claude connector, an MCP server with 78 rules that lets Claude check its own data work. The connector never sees your data. It gives the session the rules and review instructions, and Claude does the checking.
In this solo episode, Ben builds a dashboard with Claude's new dashboards artifact from U.S. Department of Energy vehicle registration data, runs it through the connector, and walks through what came back:
• A 2025 hybrid jump that looks like a classification change, not real growth
• A summary comparing against a baseline year from before a known break
• Big percent changes on tiny, rounded counts
• One color meaning three different things in adjacent charts
• Side-by-side charts with axes that don't line up
• Registration estimates described as vehicles on the road
• A missing color legend
…and the pitfalls the dashboard avoided.
He closes with two other ways to use the same rules: the free datapitfalls CLI on npm, and the Pitfall Detector in the Lab on dataliteracy.com.
Chapters
(0:00) Welcome, and why Avoiding Data Pitfalls needed a new form
(1:28) Data Pitfalls: a Claude connector so Claude can check its own work
(2:19) The data: U.S. Department of Energy vehicle registrations by fuel type
(2:42) Building a dashboard with Claude's dashboards artifact
(3:09) Adding the Data Pitfalls connector (and why it never sees your data)
(4:07) A tour of the dashboard Claude built
(5:06) Running the dashboard through all 78 rules
(5:34) Pitfall 1: the 2025 hybrid jump and measurement system drift
(6:55) Pitfall 2: a baseline year from before the break
(7:18) Pitfall 3: big percent changes on tiny, rounded counts
(9:08) Pitfall 4: one color, three meanings
(10:30) Pitfall 5: side-by-side charts with mismatched axes
(11:28) Pitfall 6: registrations aren't vehicles (the data-reality gap)
(12:22) Pitfall 7: a missing legend, and the pitfalls it avoided
(12:47) Applying all seven fixes
(13:11) From good to great: why fine-tuning decides adoption
(14:17) The datapitfalls CLI on npm
(14:47) The Lab on dataliteracy.com and the Pitfall Detector
(15:31) Demo: scanning a campaign bar chart
(16:22) Wrapping up, and guests coming soon
Links
Episode page and full transcript: https://poweredbydata.com/podcast/pitfall-proof-your-claude-dashboards
Data Pitfalls connector for Claude: https://claude.ai/directory/data-pitfalls
Pitfall Detector in the Lab: https://dataliteracy.com/lab/pitfall-detector
Data Pitfalls Detector: https://poweredbydata.com/tools/data-pitfalls
datapitfalls on npm: https://www.npmjs.com/package/datapitfalls
Avoiding Data Pitfalls: https://www.avoidingdatapitfalls.com/
Note: this is a screen-share episode, so the video version on Spotify and YouTube shows the demos.Introducing the NEW Data Literacy Learning Academy | Powered by Data Ep. 5
23/08/2026 | 12 minAfter eight years on WordPress, we tore the whole thing down and rebuilt it ourselves. This is the full tour of the new Data Literacy Learning Academy.
We retired the WordPress site we'd run on WP Engine since 2018 and replaced it with a Next.js and Tailwind application built with Claude Code: not just a marketing site, but the learning management system itself. It wasn't a one-weekend build. It took months.
Already had an account on the old site? Your badges, completed lessons, and quiz scores all carry over. Just sign up again with the same email address, since passwords don't transfer.
WHAT'S NEW
• Every course refreshed, and now on a quarterly update cadence. A two-year-old AI course is ancient history, and a one-time rewrite doesn't fix that, but a standing schedule does.
• An AI Tutor scoped to the lesson on your screen, an AI Coach that reads your learner profile, and inline definitions for any term you highlight. All in beta, all grounded in every book and course we've written using RAG (retrieval-augmented generation).
• Our first fully free course: 21 Key Traits of Data Literacy. Rate yourself on both proficiency and importance, then get a learning roadmap that points at free resources, not just ours.
• More coming! Right now, we're playing around with a live SQL sandbox running right in the browser, built on SQLite. I used it to cross-check every query in a client course before we shipped it, something I could never have done on the old site.
• New pricing tiers, including a course-only option for people who'd rather skip the AI features entirely.
CHAPTERS
0:00 Welcome back: a summer spent building
0:34 Why we retired the WordPress site after seven years
1:00 The new stack: Next.js, Tailwind, and Claude Code
1:53 Accounts, badges, and carrying your progress over
2:17 Refreshing every course — and a quarterly update cadence
3:12 AI in the lessons: inline definitions and the AI tutor
4:20 Vectorizing the books and courses with RAG
4:48 The AI coach and personalized learning paths
5:22 A free course for everyone: 21 Key Traits of Data Literacy
6:16 Under the hood: Claude Code, GitHub, Vercel, and Supabase
6:56 Demo: an in-browser SQL sandbox for hands-on courses
9:35 New pricing tiers and what each one unlocks
10:26 Cutting WP Engine and HubSpot out of the stack
11:34 Coming next: the Avoiding Data Pitfalls open-source package
LINKS
The new Data Literacy Learning Academy → https://dataliteracy.com
Episode page, show notes, and full transcript → https://poweredbydata.com/podcast/introducing-the-new-data-literacy-learning-academy
Data Pitfalls Detector → https://poweredbydata.com/tools/data-pitfalls
datapitfalls on GitHub → https://github.com/bjonesdataliteracy/datapitfalls
Ben Jones on LinkedIn → https://www.linkedin.com/in/benrjones/
Team training and workshops → https://poweredbydata.com/contact
The Powered by Data Show is hosted by Ben Jones, founder of Data Literacy. New episodes on data, AI, and the humans in the middle of it all. Subscribe so you don't miss one.
#DataLiteracy #AILiteracy #DataAnalytics #ClaudeCode #NextJS #SQLThe Human Architecture of AI Transformation | Patrick McGarry on Powered by Data
29/05/2026 | 21 minEvery leader claims to be "data-driven," yet most organizations still can't turn data and AI ambition into operational reality. In this episode of the Powered by Data Show, Ben Jones sits down with Patrick McGarry, Federal Chief Data Officer at ServiceNow, to talk about his new book, The Adaptive Organization: Leading Change in the AI Era.Patrick makes the case that transformation rarely fails because the technology is wrong. It fails because organizations treat a human and systemic challenge as a technology problem. We get into the CATALOG Framework at the heart of his book, why governance is infrastructure rather than overhead, and why the real constraint on AI is the human architecture around it.Ben also presses Patrick on the harder questions: whether governance slows you down in a world where models change weekly, where the "AI frees people up for higher-value work" story breaks down, and what honest leadership looks like when the math on headcount doesn't add up.📘 Pre-order The Adaptive Organization (paperback, hardback, and ebook), available now on Amazon ahead of the June 8th launch: https://www.amazon.com/Adaptive-Organization-Leading-Change-Era/dp/1960907123/Check out Patrick's book site: https://mcgarrycdo.com/In this conversation:00:00 Meet Patrick McGarry and the "accidental" origin of the book03:14 The CATALOG Framework and why transformation is a socio-technical problem05:19 Governance as infrastructure, not overhead: the Deming argument06:52 Does governance slow you down? Addressing the skeptical executive08:39 Building two identities: experimenting fast and scaling responsibly09:33 Governance should scale to consequences, not calendars11:44 The elephant in the room: AI, headcount, and job displacement17:53 The single highest-leverage move a leader can make today19:35 Why adapting once isn't enough, and what "choose to lead" really meansAbout the show:Powered by Data is where Ben Jones hosts candid conversations with data leaders, practitioners, and innovators. Each episode digs into the real challenges and practical approaches behind data strategy, BI modernization, AI adoption, and building data-literate organizations, all at the intersection of humans, data, and AI.
Más podcasts de Tecnología






Podcasts a la moda de Tecnología


















Acerca de The Powered by Data Show
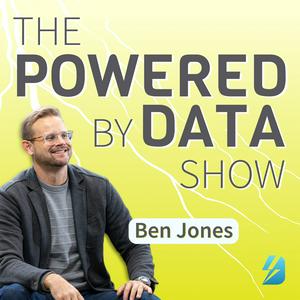
The Powered by Data Show explores the intersection of humans, data, and AI. Hosted by Ben Jones, CEO of Powered by Data, this podcast features practical conversations and smart guests on how organizations can turn data and AI into better decisions, stronger teams, and real business progress.
Perfect for executives, data leaders, and BI teams, The Powered by Data Show combines strategic thinking with real-world application. From modern analytics and AI adoption to data culture, enablement, and decision-making, we cover what it really takes to help people use data and AI well.
Sitio web del podcastEscucha The Powered by Data Show, Emilcar Daily y muchos más podcasts de todo el mundo con la aplicación de radio.es
Descarga la app gratuita: radio.es
- Añadir radios y podcasts a favoritos
- Transmisión por Wi-Fi y Bluetooth
- Carplay & Android Auto compatible
- Muchas otras funciones de la app

The Powered by Data Show: Podcasts del grupo
 España

